
The Quant Model
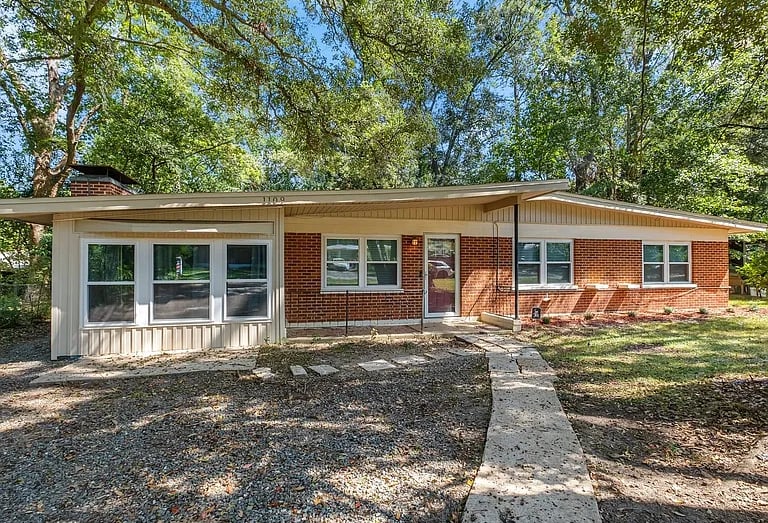

Single-family acquisition and renovation
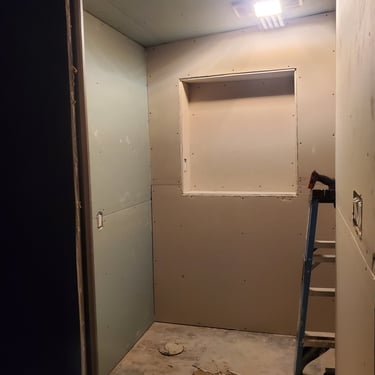
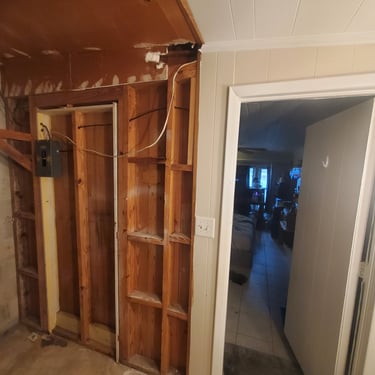
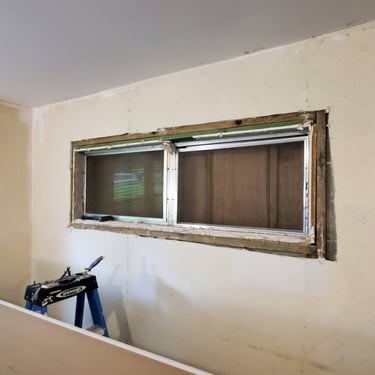
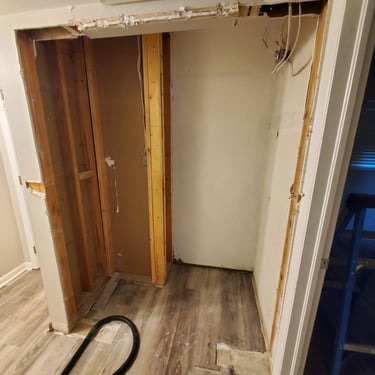
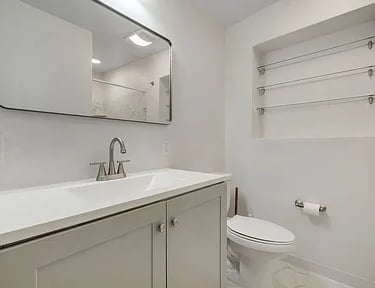
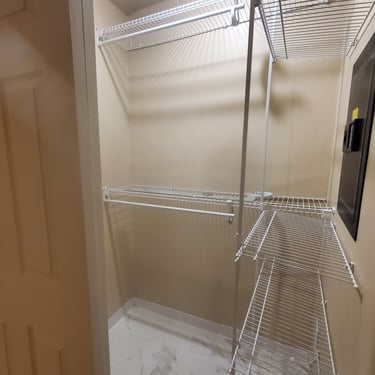
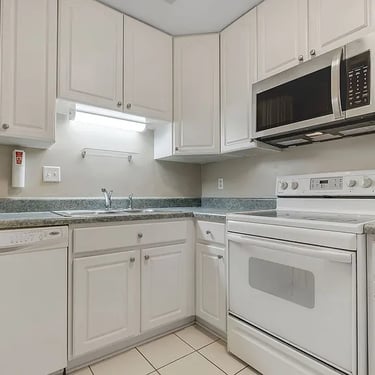


The End
The Beginning
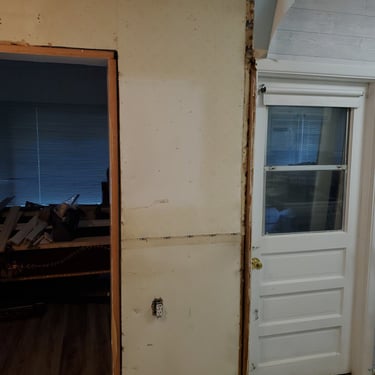
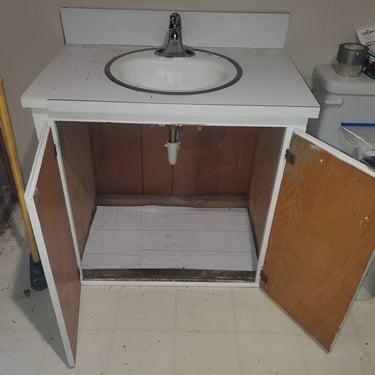
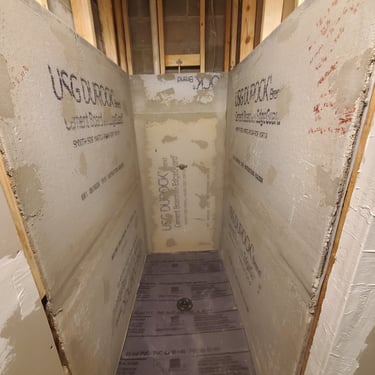
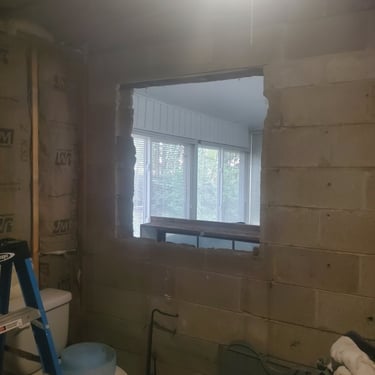
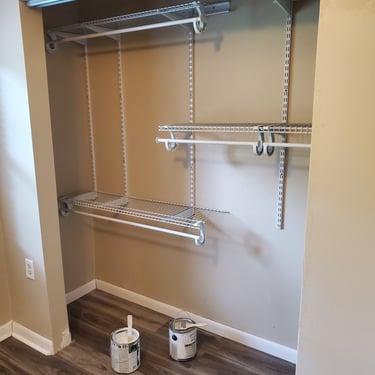
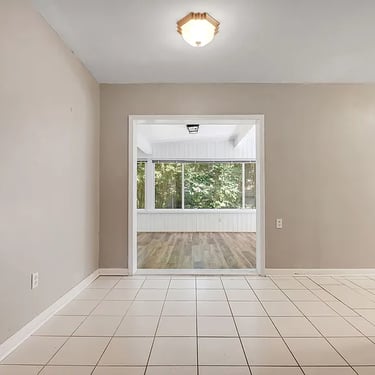
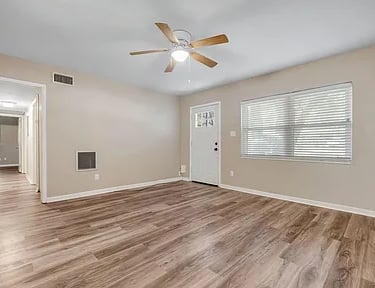
As a college student, I purchased an off-market fixer-upper and took on the challenge of renovating it with just an $8,000 budget. Over the next year, I renovated multiple rooms, increased rental value, and gained firsthand experience in project management, budgeting, and value-add investing. Was it worth it?
This page walks through two ways of evaluating an investment: a systematic, rules-based model and a real property I bought, renovated, and now rent out. One relies on data and code, the other on due diligence, contractor bids, and a lot of walkthroughs. Both come down to the same question: is this a good use of capital? I built this page to show how I think through that question from both directions.
The numbers tell part of the story, but they understate the actual cost of the real estate side of this comparison. 83% versus 24% is a real gap, and even after folding in cash flow, the property lagged a passive stock portfolio that required zero attention for 42 months. Coordinating repairs before there's a tenant to blame for delays, fielding maintenance calls on a schedule you don't control, managing a vacancy while the mortgage still comes due regardless of whether rent does, and absorbing the mental overhead of an asset that can call you at 11pm. That's not a reason to avoid SFH real estate, it's a reason to price the labor into the decision honestly, since a lower return that also comes with more stress and more of your time is a materially different trade than the numbers alone suggest.
Running the full 80/10/10 SPY/GLD/TLT portfolio blend as far back as the data allows, limited only by GLD's 2004 inception, there's exactly one entry date where a $40,000 investment in that three-asset blend grows into roughly the house's current $300,000 price: April 22, 2009, a 7.57x return in 17.2 years. It sits about a month after the March 2009 financial-crisis bottom, when stocks were near their cheapest point in decades, and the portfolio clears $300k.
Based on its actual assessed-value growth rate, the property was worth roughly $40,000 back in 1997, and it took 28.2 years of ordinary, un-optimized appreciation to reach $300,000, about 11 years longer than the portfolio. This is a textbook demonstration of in-sample overfitting, not a real result. Selecting the entry date after observing the outcome, choosing April 22, 2009 because it happens to hit the $300k target, is a form of look-ahead bias: the date was optimized against a target that wasn't known at the time, using information (today's house price) that couldn't have informed a decision made in 2009. This is functionally identical to fitting a quant model's parameters directly to backtest performance rather than to a held-out sample.
So how can we optimize the portfolio performance even further?
Overview
This asset carries a 9.0% stabilized cap rate against a 7.4% worst-case floor, both of which sit above the 4-6% range typical of core, low-volatility rental markets, and 2% above the rate for the ZIP code. That spread is a function of purchase price relative to rent, not underlying market strength, so the cap rate should be read as a signal of basis discipline rather than market quality.
Cash-on-cash return tells a different story: 5.4% stabilized, -4.3% under vacancy and turnover drag, against a common leveraged-rental target of 8-12%. The lower rate was driven by an increase in property tax, as the gap between cap rate and cash-on-cash is mortgage; a $20,208 annual debt service against $22,320 of stabilized NOI leaves thin coverage. That's workable but not resilient, since it leaves little room to absorb rate resets, future tax reassessments, or insurance increases without turning cash flow negative even in a fully occupied year.
The more relevant number for underwriting this deal going forward isn't the stabilized case, it's the spread between stabilized and worst-case. A $3,784 annual swing on a $39,211 cash basis is a large enough variance that a single bad turnover can erase a full year of return. That argues for treating this as a basis-and-appreciation play rather than a cash-flow play at current rent, with the cap rate doing more of the work in the long-run return than the levered cash-on-cash number does today.
When you compare this to a simple buy and hold portfolio of SPY, GLD, and TLT, the numbers may surprise you.
Quantitative Model
Jim Simons built Renaissance Technologies on a simple but radical premise: markets contain enough statistical structure that a sufficiently rigorous, data-driven process can find an edge, provided the process guards obsessively against fooling itself. The Medallion Fund's results are the standard reference point for what that approach can do at its best, but what made Renaissance different wasn't just the returns, it was the discipline behind them.
The pipeline runs as five decoupled stages, ingestion, processing, signal generation, execution, and analytics, so a flaw in ingestion shows up not in the backtest but as silent decay months into live trading. The signal engine holds the actual alpha, and live degradation is almost always overfitting, ignored transaction costs, or an untrained regime shift, none of which a backtest Sharpe ratio reveals, which is why execution and analytics exist to catch the gap between theoretical and realized performance. Judged like the real estate numbers, the real question isn't what the backtest shows, it's the worst-case drawdown and whether the strategy survives it.