
Real Estate By the Numbers
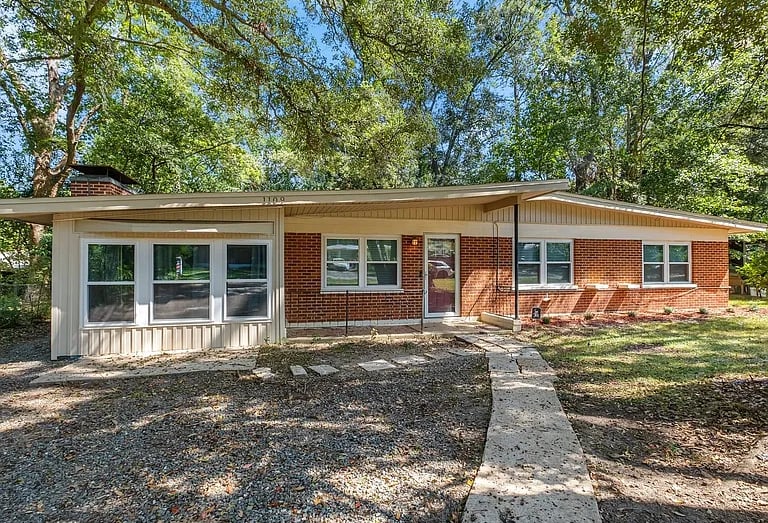
Single-family acquisition and renovation
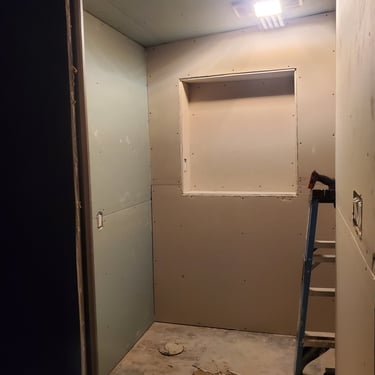
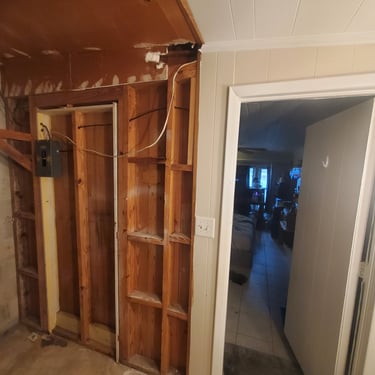

The End
The Beginning
As a college student, I purchased an off-market SFH and took on the challenge of renovating it with just an $10,000 budget. Over the next year, I renovated multiple rooms, increased rental value, and gained firsthand experience in project management, budgeting, and value-add investing. Was it worth it?
This page evaluates a single-family rental acquired for $249,000 in the summer of 2022, financed with $23,562 down at a locked-in 4.75% rate, and renovated for $15,649 to convert the property from a 3 bed/1.5 bath layout to 4 bed/2 bath, a configuration change that created an estimated $61,000-$81,000 in post-renovation value beyond ordinary appreciation, supported by both sales comparison data and a scarce local 4-bed inventory. The property now produces $22,320 in stabilized NOI against $26,400 in gross rent, yielding a 9.0% cap rate and modest but positive cash flow of $2,112 annually, with a worst-case scenario incorporating vacancy and turnover dragging cash flow to negative $1,672. Modeled forward 10 years, the deal is projected to grow $39,211 of invested capital to $293,285 under a buy-and-hold strategy, a 7.48x multiple, outperforming a refinance-and-reallocate strategy given current market rates well above the property's existing loan. It also outperforms a full sale and reallocation into a diversified stock portfolio. The primary risks are a thin post-renovation comp set, cash flow coverage that leaves little room for tax or insurance increases, and single-asset concentration, each partially offset by a dedicated cash reserve and the property's below-market fixed-rate financing.
The more significant finding of this analysis, however, is that the deal's outperformance is driven almost entirely by leverage and a one-time forced-appreciation event rather than by real estate as an asset class. Applying the same leverage ratio used in this deal to a diversified stock portfolio produces a 29.5% CAGR against the property's 22.3% (after forced appreciation), underscoring that the recommendation to hold this asset rests on its below-market debt and completed value-add, not on a belief that real estate outperforms equities on a level playing field.
Executive Summary
The subject property is a single-family rental built in 1960, comprising approximately 1,700 square feet. At acquisition, the property was in an out-dated but livable condition, requiring cosmetic and functional renovation to bring finishes and systems up to current market standard.
The subject is located in a market characterized by growing rents and rising home prices, indicating positive demand fundamentals for both the rental hold strategy and any future resale exit.
The comp set reflects an adjusted sale price range of $241,500 to $253,000, and the property was acquired for $249,000 with financing. All three comps are C3 condition, arm's length transactions, with low net adjustments (5.0% to 12.3%), reinforcing this as a reliable valuation anchor. The subject, at 1,700 square feet, is notably larger than all three comps (1,146 to 1,326 sq ft), suggesting room for the subject to command a higher absolute value even while landing within the comp range on a per-square-foot basis.
Acquisition Numbers
The property generates $26,400 in annual gross rent at current market lease terms, reflecting the stabilized post-renovation rate. True operating expenses, property management and lawn service, total $4,080 annually, leaving a stabilized Net Operating Income of $22,320 before debt service. Property taxes ($4,300), mortgage insurance ($403), and homeowners insurance ($1,300) are escrowed directly into the monthly mortgage payment rather than sitting separately as operating expenses, so they are excluded from NOI and instead captured within the $20,208 total annual debt service (principal, interest, taxes, and insurance).
Applying that debt service against stabilized NOI leaves a net cash flow of $2,112 in a fully occupied year with no one-time costs. Under a worst-case scenario incorporating one month of vacancy, a lease/turnover fee, and miscellaneous costs, NOI falls to $18,536, driving net cash flow negative to ($1,672). This swing illustrates that the deal's cash flow position is thin but not fragile in a base case, while a single bad turnover year can erase the entire annual return, a dynamic that carries directly into the valuation and returns analysis that follow.
Operating Numbers
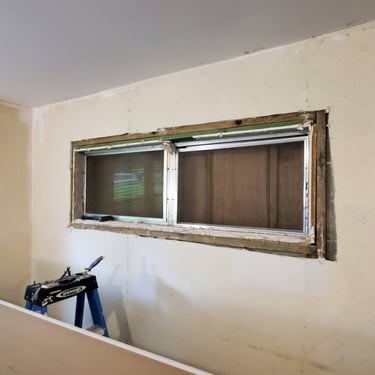
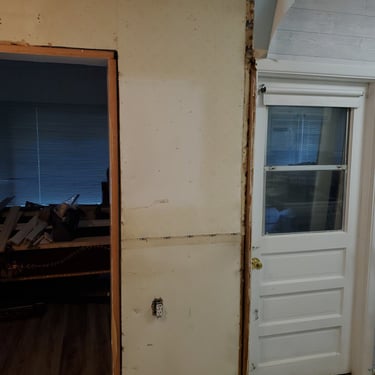
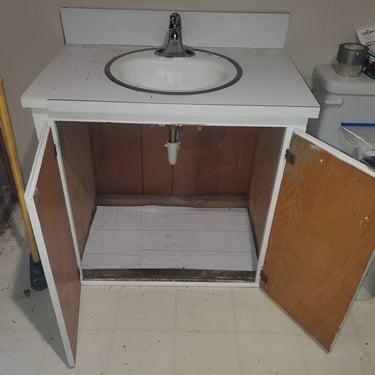
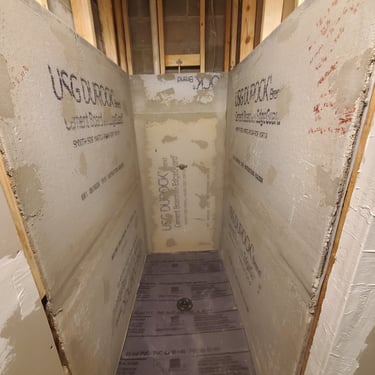
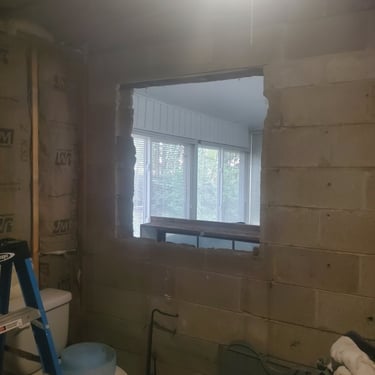
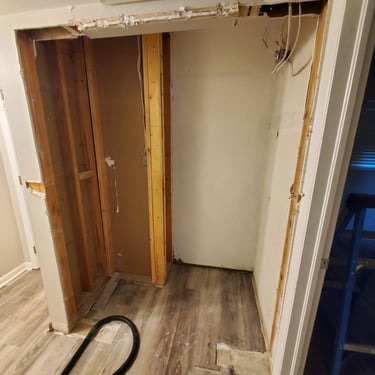
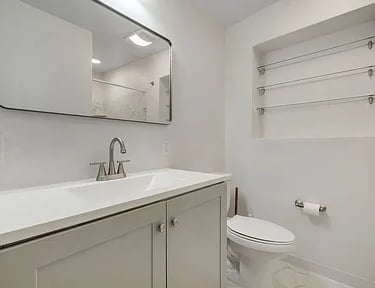
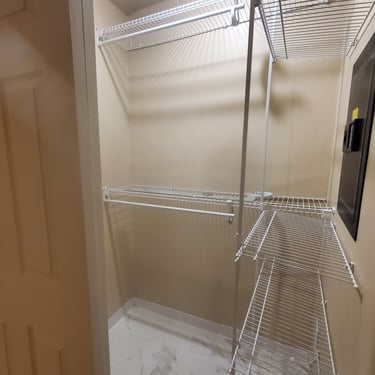
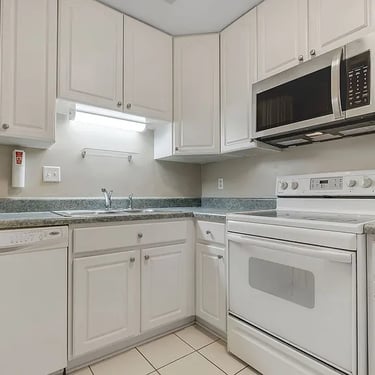
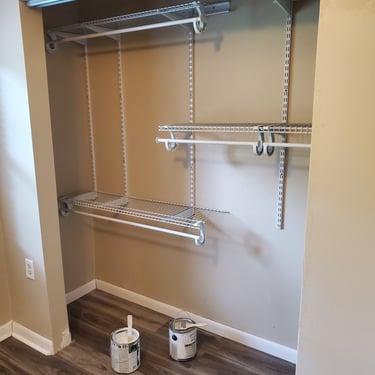
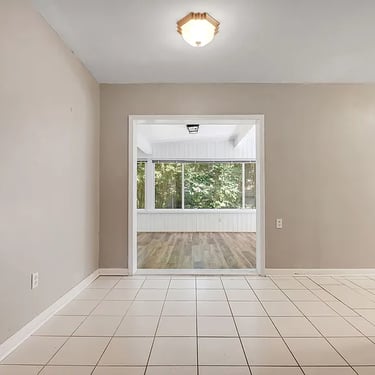
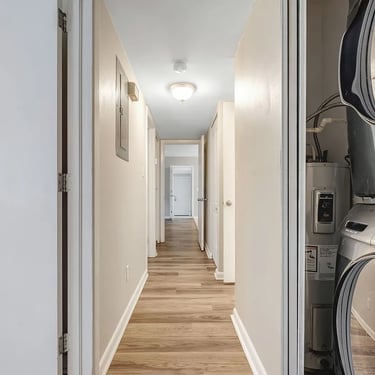
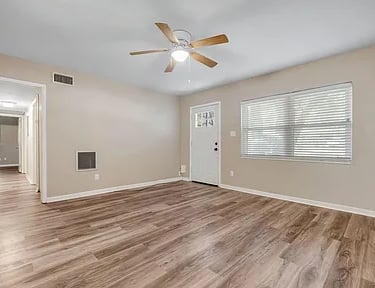
With renovation complete, the property's configuration changed materially, not just cosmetically. The subject was converted from a 3 bed / 1.5 bath layout to a 4 bed / 2 bath layout, adding a bedroom via closet conversion and completing a previously defunct half bath into a full bath. This is a functional upgrade in the property's competitive set, not merely a finish-level improvement, and it shifts the relevant comparison away from the original 3-bed comp set used at acquisition.
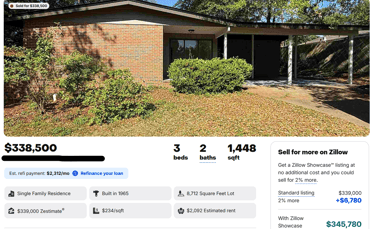
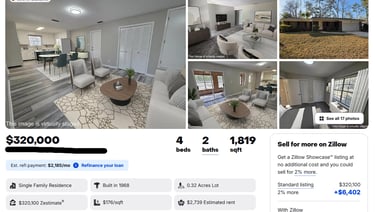
With the property now converted to a 4 bed / 2 bath layout, the relevant comp set shifts from the 3-bed acquisition comps to a genuinely different competitive tier. Three post-renovation comparables support this: a 4 bed / 2 bath home built in 1968 at 1,819 square feet sold for $320,000, while two 3 bed / 2 bath homes, smaller and slightly newer, sold for $338,500 and $340,000. Notably, both 3-bed comps sold above the 4-bed comp on a total-dollar basis despite offering one fewer bedroom, suggesting the $320,000 sale may understate what a 4-bed configuration in this submarket should command, either due to condition, lot characteristics, or timing not reflected in the raw sale price.
Valuation
Risk Factors & Mitigants
The primary risks in this transaction are a thin post-renovation comp set, where closed sales ($320,000-$340,000) lag well behind the $550,000 current listing floor for comparable 4-bed homes. A stabilized cash flow position of $2,112 annually leaves limited cushion against a worst-case scenario that turns negative to ($1,672). This is mitigated by anchoring the reconciled valuation ($310,000-$330,000) conservatively to closed comps rather than current listings, and by the property's fixed-rate loan, which removes rate-reset exposure from the cash flow equation entirely.
Execution risk on the renovation itself is now realized rather than forward-looking, since the project was completed slightly over budget with a contingency reserve and the resulting bedroom/bathroom upgrade is already reflected in current comps rather than remaining speculative. The deal also carries concentration risk as a single-asset, single-market position, though this is offset by a dedicated cash reserve fund held specifically to absorb tax reassessments, insurance increases, or vacancy without forcing a distressed outcome.
The more decisive data point is market scarcity. As of July 2026, the lowest-priced 4 bed / 2 bath home currently listed in this part of town is $550,000, a figure well above all three comps used here. This indicates the existing comp set reflects a temporarily thin or lagging sales history rather than current asking-price reality, and that true replacement value for a 4-bed home in this submarket may be substantially higher than recent closed sales suggest. This kind of gap, where closed comps lag current listing prices, is common in appreciating markets and typically resolves as more 4-bed inventory transacts at levels closer to current asking prices.
Taken together, the comp sales support a conservative value in the low $300,000s, consistent with the $320,000 closed 4-bed comp, while the $550,000 current listing floor suggests meaningful upside if the market continues re-rating 4-bed inventory upward. A defensible reconciled value for underwriting purposes sits in the $310,000 to $330,000 range, treating the closed comps as the valuation floor and the listing-price scarcity signal as an indicator of unrealized upside rather than the basis for the number itself.
The $249,000 acquisition price, set against a conservative $310,000-$330,000 post-renovation valuation, implies roughly $61,000 to $81,000 in value created through the renovation program, which is the more relevant figure for this section than the acquisition-stage comp analysis.


Sensitivity Analysis
The base case reflects current stabilized performance: full occupancy at $26,400 in annual rent against a reconciled post-renovation value of $310,000-$330,000, producing $2,112 in net cash flow and roughly $61,000-$81,000 in value created above the $249,000 acquisition price.
The downside case layers in one month of vacancy plus turnover and misc. costs, dropping NOI to $18,536 and turning cash flow negative to ($1,672), with further valuation risk if the market fails to close the gap between recent closed comps ($320,000-$340,000) and the current $550,000 listing floor for comparable 4-bed homes.
The upside case assumes partial re-rating toward that listing floor, which would meaningfully improve both equity value and, upon re-lease at a rate reflecting the new 4-bed/2-bath configuration, rental income, while the acquisition basis and debt service remain fixed. The deal's single most important sensitivity is exit valuation rather than rent growth or renovation cost, both of which are now known and realized, since debt service consumes nearly all stabilized NOI, making this fundamentally an appreciation-and-basis play rather than a cash-flow play at current rent levels.
Full Analysis
Using the standard leveraged-return identity, scaled to match the actual leverage ratio used in the real estate deal rather than an arbitrary dollar amount:
At acquisition, a $23,562 down payment financed a $249,000 purchase, meaning the loan covered 90.46% of the purchase price, with equity representing 9.46%. Applying that same ratio to the full $39,211 of capital actually invested in this deal implies a parallel stock position of:
Asset Size = Equity ÷ (1 − LTV) = $39,211 ÷ 0.0946 = $414,566
Debt = $414,566 − $39,211 = $375,355
Running this at an 8% stock return, a realistic margin rate of 6.5% for a balance this size, interest-only with debt serviced annually rather than left to compound, over a 10-year hold:
Future value of the leveraged position: $414,566 × 1.08¹⁰ = $895,032
Annual interest cost on $375,355 at 6.5%: ≈$24,398
Debt balance after 10 years: $375,355 (unchanged, interest-only)
Equity at year 10: $895,032 − $375,355 = $519,677
Multiple on $39,211: 13.25x
Blended CAGR: 29.5%
This is the properly leverage-matched comparison, using the identical debt-to-equity structure as the actual real estate deal, and it outperforms every real estate scenario modeled, including Buy & Hold.
And analyzing the same capital invested over the same time horizon:
What Happens If We Apply the Same Leverage to Stocks
Real estate wins here not because 3% appreciation beats an 8% stock return, but because leverage amplifies the 3% into a levered return that competes with equities, while the stock comparison above is entirely unlevered. That's an apples-to-oranges comparison hiding inside an apples-to-apples table.
The Uncomfortable Question This Raises
If the same leverage ratio applied to a higher-returning asset produces a better outcome, why is borrowing against a house at 4.75% treated as prudent, disciplined investing, while borrowing at a similar rate to hold a diversified stock portfolio is generally viewed as reckless speculation? The leverage mechanics themselves don't distinguish between the two assets. What does distinguish them is a real structural difference, not just a cultural bias: this $24,398 in annual interest has no natural source of repayment, in other words, you are paying 6.5% to obtain a better return. Real estate's $14,205 in annual P&I is paid by the tenant's rent, a cash flow generated by the asset itself, making that leverage self-servicing. A stock portfolio brings in no equivalent income (dividend portfolios aside), so this $24,398 would have to be funded entirely from outside income, like a paycheck, for the full 10-year hold.
So what if we could leverage these stock returns without using loans? Coming Soon!